
A plastic product is rarely just one polymer.
Engineering plastics may contain a base resin or polymer blend together with flame retardants, impact modifiers, fillers, lubricants, antioxidants, stabilizers, pigments, processing aids and other functional ingredients. Two materials can therefore both be identified as ABS, PP, PVC or PA while performing very differently in impact resistance, flame retardancy, heat resistance, aging or processing.
Plastic composition testing goes beyond basic polymer identification. It investigates what is present in a plastic formulation, estimates selected component levels where technically possible, and compares formulation differences between suppliers, production batches, failed parts or benchmark materials.
For manufacturers, this information can support incoming quality control, supplier qualification, product troubleshooting, competitive benchmarking and raw-material replacement.
Xinbodi provides plastic and polymer testing for resins, compounds, masterbatches, molded parts, films and other polymer materials, combining chemical, thermal and elemental techniques according to the analytical question.
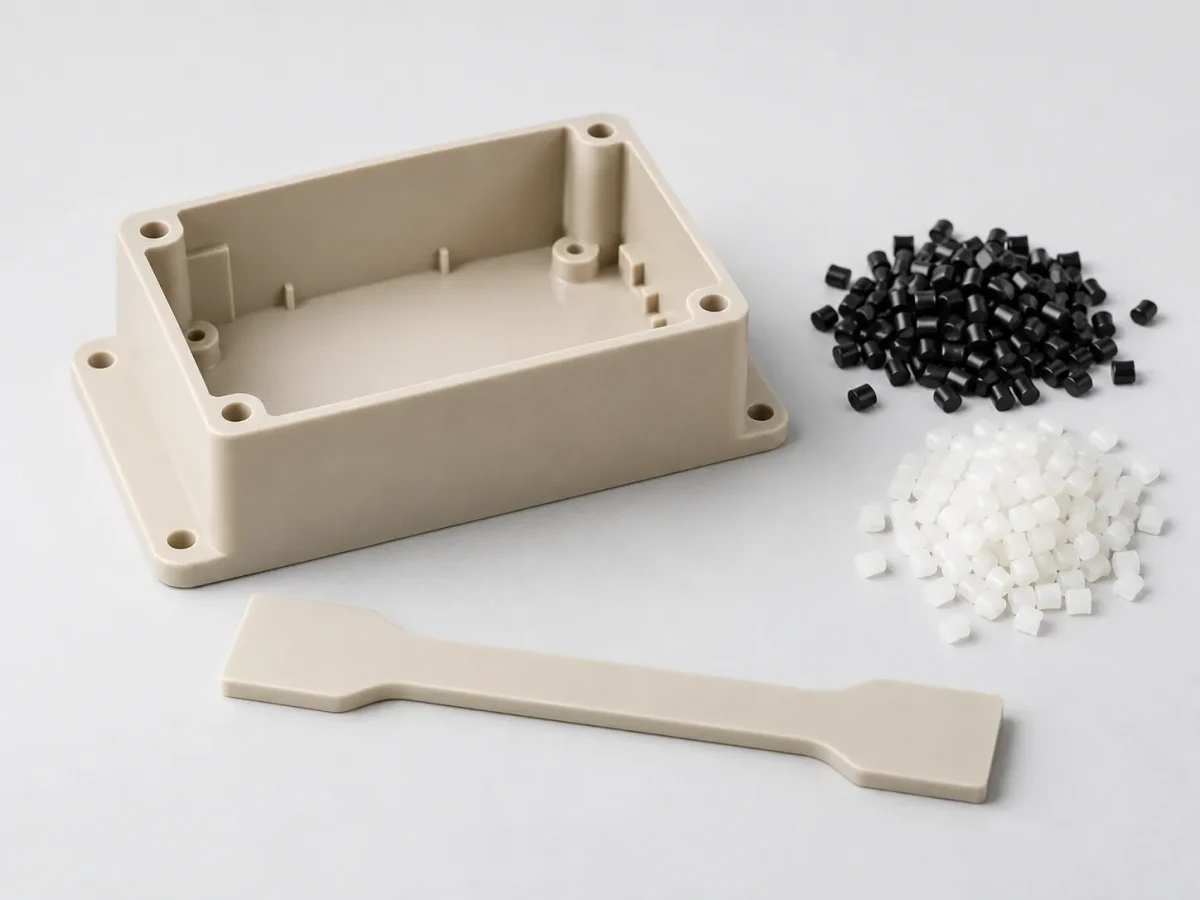
What Is Plastic Composition Testing?
Plastic composition testing is the analytical characterization of the different materials that make up a plastic product.
A typical investigation may evaluate:
| Composition Area | What the Analysis Can Determine |
|---|---|
| Base polymer | ABS, PP, PE, PVC, PA, PC, PET, POM and other resin systems |
| Polymer blends | Multiple polymer phases or copolymer systems |
| Fillers | Mineral fillers, glass fibers, calcium carbonate, silica and other inorganic materials |
| Flame retardants | Brominated, phosphorus-containing or inorganic flame-retardant systems |
| Impact modifiers | Rubber-rich or core-shell modifier systems |
| Plasticizers | Low-molecular-weight compounds used to modify flexibility |
| Stabilizers | Antioxidants, heat stabilizers and UV stabilizers |
| Processing aids | Lubricants, slip agents and other process-related additives |
| Pigments | Organic or inorganic colorants |
| Unexpected materials | Contamination, recycled-material variation or foreign components |
The objective is not necessarily to identify every molecule in the sample.
Instead, the analytical plan should be designed around the customer’s decision:
What is this material made of, what is different from the reference, and could those differences explain its performance?
Plastic Composition Testing vs. Polymer Identification
Polymer identification answers a relatively narrow question:
What is the main plastic?
For example, FTIR may determine that an unknown molded component is ABS.
But that result alone does not explain whether the material contains:
- a different ABS grade;
- more or less rubber phase;
- a flame-retardant package;
- an impact modifier;
- mineral filler;
- processing lubricants;
- stabilizers.
That distinction becomes important when two materials have the same polymer identity but significantly different performance.
Plastic composition testing therefore focuses on the formulation around the polymer, not only the polymer name.
For broader product and material projects, Xinbodi’s chemical composition analysis services are used to identify major and minor components, quantify selected constituents and compare reference samples with unknown or abnormal materials.
Why Manufacturers Use Plastic Composition Testing
Supplier and Batch Comparison
A supplier may state that the polymer grade has not changed, while production experiences different impact strength, shrinkage, color, odor or processing behavior.
Composition testing can compare:
approved vs. new batch, supplier A vs. supplier B, or good vs. abnormal material.
This helps determine whether changes exist in the resin, filler system, additives or thermal characteristics.
Plastic Formulation Analysis
For modified engineering plastics, performance depends on the complete formulation.
For example, flame-retardant ABS may require a balance between:
polymer matrix + flame retardant + synergist + impact modifier + processing system
Increasing one component does not necessarily improve overall performance.
A higher flame-retardant loading may improve burning behavior while reducing toughness. Adding mineral filler may reduce cost or change stiffness but can also affect impact performance.
Composition testing helps R&D teams understand these trade-offs before changing the material blindly.
Imported Material Replacement
Manufacturers replacing an imported material often know its nominal resin family but not its detailed formulation.
If both products are labeled “flame-retardant ABS,” simply matching the ABS designation is not enough.
Laboratory comparison can identify meaningful differences in resin characteristics, flame-retardant chemistry, mineral filler, impact-modifier system and other additives.
Where deeper formulation reconstruction is required, plastic composition testing can be extended into deformulation and reverse engineering.
Plastic Failure Investigation
Composition testing is also useful when a plastic passes routine incoming inspection but fails during service.
Typical problems include cracking, brittleness, poor low-temperature impact performance, discoloration, flame-retardant inconsistency or supplier-related performance changes.
The important question is not simply whether the failed plastic contains ABS or PP.
It is whether the failed sample contains the same formulation architecture as the qualified material.
How Is Plastic Composition Tested?
No single analytical technique can characterize an entire plastic formulation.
The method combination depends on the polymer system, expected additives and required level of confidence.

FTIR for Polymer and Functional-Group Identification
FTIR is commonly used as the first screening tool.
It can help identify:
polymer family, major resin chemistry and characteristic functional groups associated with certain additives or fillers.
However, minor additives may be obscured by the strong spectrum of the base resin.
A similar FTIR spectrum therefore does not prove that two plastic formulations are equivalent.
TGA for Organic and Inorganic Fraction Comparison
Thermogravimetric analysis measures mass changes as a material is heated under controlled conditions.
TGA can help distinguish broad volatile, polymeric and residual inorganic fractions and is particularly useful for comparing filled plastic materials.
The current ASTM E1131 standard for compositional analysis by thermogravimetry specifically describes TGA as a tool for quality control, material screening and comparative compositional analysis, including filled plastic materials.
However, TGA generally does not mean that every overlapping organic component can be assigned a precise individual percentage.
For complex formulations, results need to be combined with chemical separation and other analytical methods.
DSC for Polymer Thermal Behavior
DSC can evaluate thermal transitions such as glass transition, melting and crystallization behavior.
In plastic formulation comparison, these results can provide evidence of differences in polymer structure, blend composition, crystallinity or rubber-rich phases.
DSC is best treated as supporting evidence rather than a stand-alone method for quantifying a specific additive or monomer fraction.
Py-GC-MS and GC-MS for Organic Components
GC-MS is useful for extractable, volatile and semi-volatile organic components.
Py-GC-MS extends the analysis to polymers and high-molecular-weight materials by thermally breaking them into characteristic fragments.
These techniques can help investigate:
polymer backbone chemistry, plasticizers, lubricants, processing aids, organic flame retardants and impact-modifier signatures.
Elemental Analysis for Inorganic Additives
XRF, ICP-OES, ICP-MS, SEM-EDS and dedicated halogen methods can provide complementary elemental information.
For example:
Sb may support identification of an antimony-based flame-retardant synergist.
Br may indicate a brominated flame-retardant system.
Ca, Mg, Si or Ti may support investigation of mineral fillers or pigments.
Elemental results alone normally identify elements rather than complete chemical compounds, so formulation interpretation requires cross-verification with other techniques.
What Can Be Quantified in Plastic Composition Testing?
Customers frequently ask whether a laboratory can provide the exact percentage of every ingredient.
The answer depends on the material.
Major components and selected targets can often be quantified or estimated with reasonable confidence when appropriate methods and reference standards are available.
For other components, especially complex polymer blends and proprietary additive packages, the result may be more appropriately reported as an estimated formulation range.
A useful plastic composition report should therefore distinguish between:
| Result Type | Meaning |
|---|---|
| Directly quantified | Measured using a suitable quantitative method |
| Semi-quantitative | Estimated from instrument response or calibrated comparison |
| Formulation estimate | Derived from several analytical results integrated together |
| Identified / consistent with | Chemistry supported by analytical evidence but not necessarily quantitatively confirmed |
This distinction is especially important in reverse-engineering projects.
Case Study: Why Two Flame-Retardant ABS Materials Performed Differently
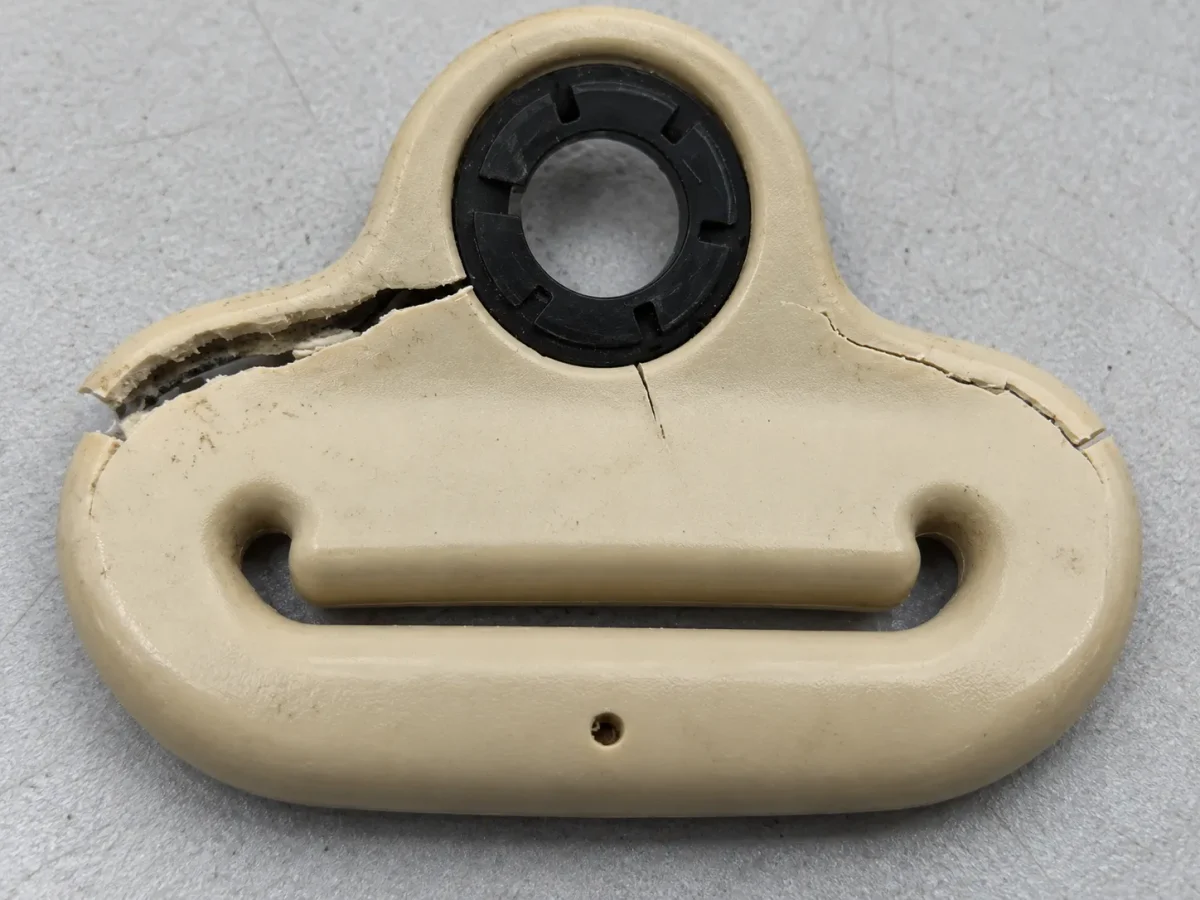
A home-appliance manufacturer was developing a V-0-level flame-retardant ABS material for an electrical-product housing.
The company’s in-house material could achieve the required result in its vertical-burning evaluation.
However, compared with an imported benchmark material, two important performance gaps remained.
Room-temperature notched-impact performance was only about 60% of the benchmark, and during low-temperature winter drop testing the molded housing was prone to brittle cracking.
The initial assumption was that too much flame retardant had been added.
The manufacturer therefore submitted the imported benchmark and its own ABS compound for comparative plastic composition testing.
Analytical Strategy for the ABS Formulation Comparison
The investigation combined polymer, thermal, organic and elemental information rather than relying on a single spectrum.
FTIR was used to compare the ABS matrix and major formulation chemistry.
TGA evaluated differences in decomposition behavior and broad organic/inorganic fractions.
DSC provided supporting information about thermal transitions and differences associated with the ABS polymer system.
Py-GC-MS was used to investigate polymer and organic-additive fingerprints.
Elemental and halogen analysis was used to compare bromine, antimony and other relevant inorganic indicators.
Finally, composition results were evaluated together with the impact and flame-retardancy performance data.
What the Plastic Composition Testing Revealed
The integrated analysis indicated that the performance gap was not simply caused by “too much flame retardant.”
Instead, several formulation differences were present simultaneously.
The following values should be treated as approximate formulation estimates derived from the combined analytical evidence, rather than as direct single-instrument measurements.
| Formulation Component | Imported Benchmark | In-House ABS | Main Difference |
|---|---|---|---|
| ABS matrix | ~78.5 wt% | ~72.1 wt% | Benchmark contained a larger polymer fraction |
| Estimated butadiene / rubber-phase contribution within ABS | ~18% | ~12% | In-house matrix had lower toughness contribution |
| Brominated flame-retardant system | ~12.3 wt%, brominated epoxy-type | ~15.6 wt%, DBDPE-type | Different flame-retardant chemistry and higher loading in the in-house material |
| Antimony trioxide synergist | ~4.2 wt% | ~5.8 wt% | Higher synergist level in the in-house formulation |
| MBS-type impact modifier | ~3.5 wt% | Not detected at meaningful level | Benchmark contained a dedicated impact-modifier system |
| Mineral filler, consistent with talc-type Mg-Si filler | Not significant | ~5.7 wt% | In-house material contained additional mineral filler |
| Processing / lubricant-type additives | ~1.5 wt% | ~0.8 wt% | Different processing-aid balance |
The total-bromine results also showed a clear compositional difference between the two materials, with approximately 8.7% Br in the benchmark and 11.2% in the in-house sample.
The exact brominated flame-retardant concentration could not be calculated from total bromine alone because bromine fraction depends on the specific flame-retardant chemistry. The bromine result was therefore used as cross-validation rather than as a direct one-step measurement of flame-retardant loading.
Why the In-House ABS Had Poorer Impact Performance
The results pointed to three interacting formulation differences.
Lower Rubber-Phase Contribution
The in-house ABS matrix showed a lower estimated butadiene/rubber-phase contribution than the imported benchmark.
The rubber phase is an important contributor to toughness in ABS.
A lower rubber contribution can therefore reduce impact resistance, particularly when the material is subjected to low temperatures.
Higher and Different Flame-Retardant Loading
The imported benchmark used a brominated epoxy-type flame-retardant system, while the in-house material was consistent with a DBDPE-based system at a higher estimated loading.
This does not mean DBDPE is inherently unsuitable.
The problem was that the overall balance between resin, flame retardant, synergist and impact resistance differed substantially from the benchmark.
Missing Impact Modifier and Additional Mineral Filler
The benchmark contained an MBS-type impact modifier, while the in-house formulation did not show a meaningful dedicated MBS contribution.
At the same time, the in-house formulation contained approximately 5.7 wt% mineral filler consistent with a talc-type system.
For this particular application, the combination of lower rubber-phase contribution, no comparable impact-modifier system and additional mineral filler was consistent with the observed reduction in impact toughness.
The failure therefore could not be explained by flame-retardant content alone.
How the Formulation Was Adjusted
Based on the comparative results, the development strategy was shifted from simply reducing flame retardant to balancing the full formulation.
The revised approach used a tougher ABS matrix, changed the flame-retardant system toward the benchmark formulation architecture, introduced an MBS-type impact modifier and removed the unnecessary mineral filler.
Subsequent customer validation showed that the revised material maintained the required V-0-level vertical-burning performance.
Room-temperature impact performance improved to approximately 72% of the imported benchmark, and the previously observed cracking in the −10°C low-temperature impact evaluation was substantially resolved.
The case demonstrates an important principle:
A plastic material may meet one specification while still having an unbalanced formulation.
Plastic Composition Testing for Supplier Quality Control
The same approach can be used even when a product has not yet failed.
A manufacturer can establish a qualified reference material and periodically compare new supplier batches against it.
Instead of testing every possible ingredient routinely, the initial composition study can identify the formulation characteristics that matter most.
Future quality control can then focus on selected indicators such as:
polymer identity, filler level, additive markers, thermal profile or key elemental ratios.
This can make supplier-change investigations much more efficient.
Plastic Composition Testing for Competitive Benchmarking
Another common application is competitive material analysis.
A benchmark material may have better:
impact strength, flame resistance, aging performance, appearance, processability or dimensional stability.
Composition testing can help determine whether that advantage comes from:
resin grade, polymer blend, filler system, impact modifier, flame retardant, stabilizer package or another formulation difference.
The objective should not be to assume that one detected additive is responsible for the performance difference.
The more useful approach is to reconstruct the functional architecture of the formulation and compare it with the customer’s material.
What Samples Should You Send?
For a formulation-comparison project, the strongest analytical design usually includes both the target sample and a reference.
Examples include:
competitor vs. your product, approved supplier vs. new supplier, good batch vs. bad batch, or failed part vs. normal part.
Providing the application, observed performance gap and known material grade also helps the laboratory select the most relevant analytical methods.
If the objective is material replacement, include the properties that must be retained, such as impact resistance, flame retardancy, heat resistance or processing behavior.
What Plastic Composition Testing Cannot Tell You Automatically
A composition result should not be treated as a complete performance prediction.
Two plastics with similar ingredient lists can still behave differently because of molecular weight, polymer morphology, filler dispersion, processing history, moisture, residual stress or molding conditions.
Likewise, detecting a particular additive does not automatically prove that it caused a failure.
That is why composition testing is most powerful when combined with appropriate physical testing, thermal characterization and a reference sample.
How Xinbodi Supports Plastic Composition Testing
Xinbodi provides plastic composition testing for engineering plastics, polymer compounds, molded components, masterbatches, films and other formulated plastic materials.
Depending on the problem, the analytical plan may combine FTIR, TGA, DSC, GC-MS, Py-GC-MS, elemental analysis and other complementary techniques.
The objective is not simply to return an instrument spectrum.
Xinbodi helps manufacturers determine:
what the plastic is made of, how it differs from the reference, and which composition differences are technically relevant to product performance.
Projects can support supplier comparison, incoming quality control, plastic formulation analysis, failure investigation, imported-material replacement and competitive benchmarking.
For projects requiring deeper formulation reconstruction, Xinbodi can extend the work from plastic composition testing into deformulation and reverse engineering, helping R&D teams move from analytical results toward practical material and formulation decisions.