
A thermal insulation coating can contain hollow glass microspheres and still fail to reach its target thermal performance.
In this project, a manufacturer was developing a water-based architectural insulation coating. The in-house product met basic appearance and adhesion requirements, but its measured thermal conductivity remained approximately 0.092 W/(m·K), compared with about 0.065 W/(m·K) for the benchmark sample under the project test conditions.
The development coating also showed settling, phase separation, and reduced film stability during storage.
Instead of continuing to adjust individual raw materials by trial and error, the benchmark and development samples were compared through coating formulation analysis and reverse engineering.
The objective was not simply to identify ingredients. It was to determine which formulation differences could reasonably explain the performance gap and provide clearer directions for the next formulation trial.
Coating Formulation Analysis: Benchmark vs. Development Sample
The analysis showed that the two coatings were based on substantially different formulation structures.
The values below are estimated formulation profiles derived from analytical reconstruction, rather than exact manufacturing recipes.
| Formulation factor | Benchmark coating | Development coating |
|---|---|---|
| Binder | Pure acrylic emulsion, ~42.3% | Styrene-acrylic emulsion, ~40.8% |
| Hollow glass microspheres | ~18.6%, graded particle sizes | ~14.2%, mainly single-size particles |
| Mica-type platelet filler | ~6.2% | Not detected at a comparable level |
| Calcium carbonate-rich filler | ~12.5% | ~22.7% |
| Dispersant | ~1.2% | ~0.4% |
| Defoamer | ~0.3% | ~0.1% |
| Cellulosic thickener | ~0.4% | Not identified at a comparable level |
| Silane-type additive | Detected | Not detected under the applied conditions |
| Water | ~18.25% | ~21.8% |
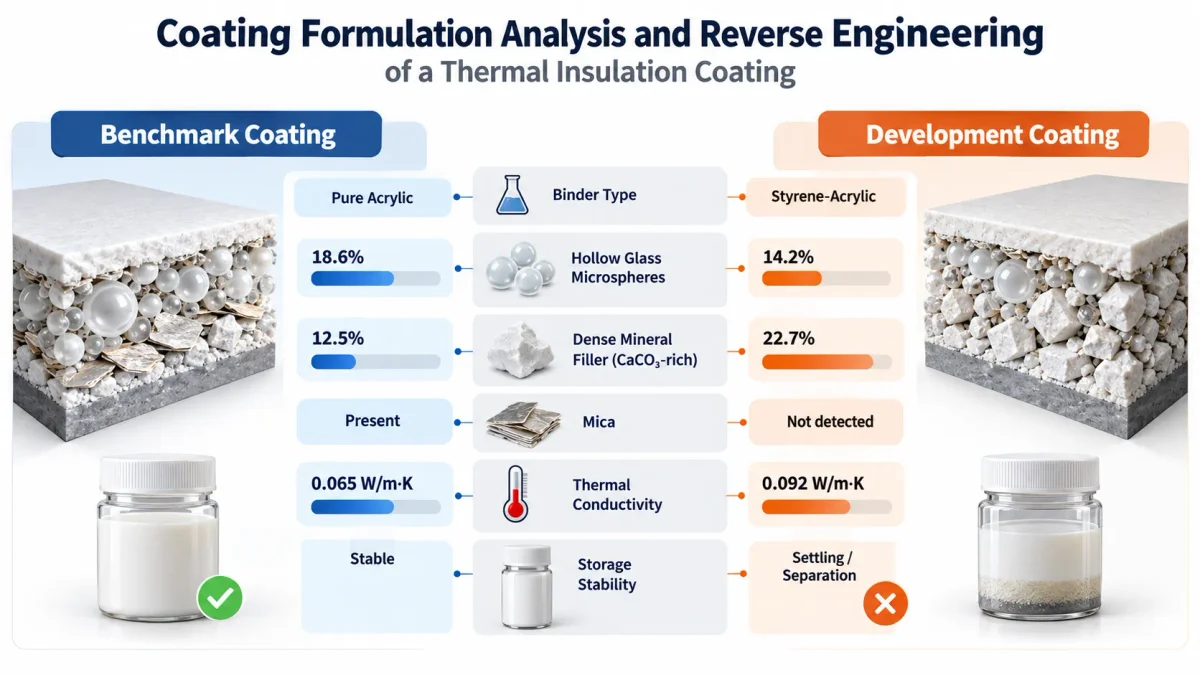
The most important finding was that the difference was not limited to hollow glass microsphere content.
Binder chemistry, filler balance, particle-size distribution, rheology, dispersion, and interface-related additives were all different.
This is where coating reverse engineering services can provide more useful information than adjusting a single ingredient without understanding the complete formulation.
Coating Reverse Engineering Methods
Because a water-based coating contains polymers, inorganic fillers, functional particles, and low-level additives, no single analytical method can reconstruct the entire system.
The project combined several techniques:
- FTIR to identify major polymer and organic material families.
- TGA to compare volatile, polymer, and inorganic fractions.
- ICP to provide elemental evidence related to inorganic fillers.
- GC-MS to screen extractable organic additives and low-molecular-weight components.
- Particle-size analysis to compare hollow filler distributions.
- Thermal conductivity testing to compare the performance of the two submitted samples.
Elemental or chromatographic results were interpreted together rather than used in isolation. For example, calcium detected by elemental analysis can support the presence of a calcium-containing filler, but filler identity requires supporting chemical or thermal evidence.
This multi-method approach is also used in chemical composition analysis when a formulated product contains several interacting material systems.
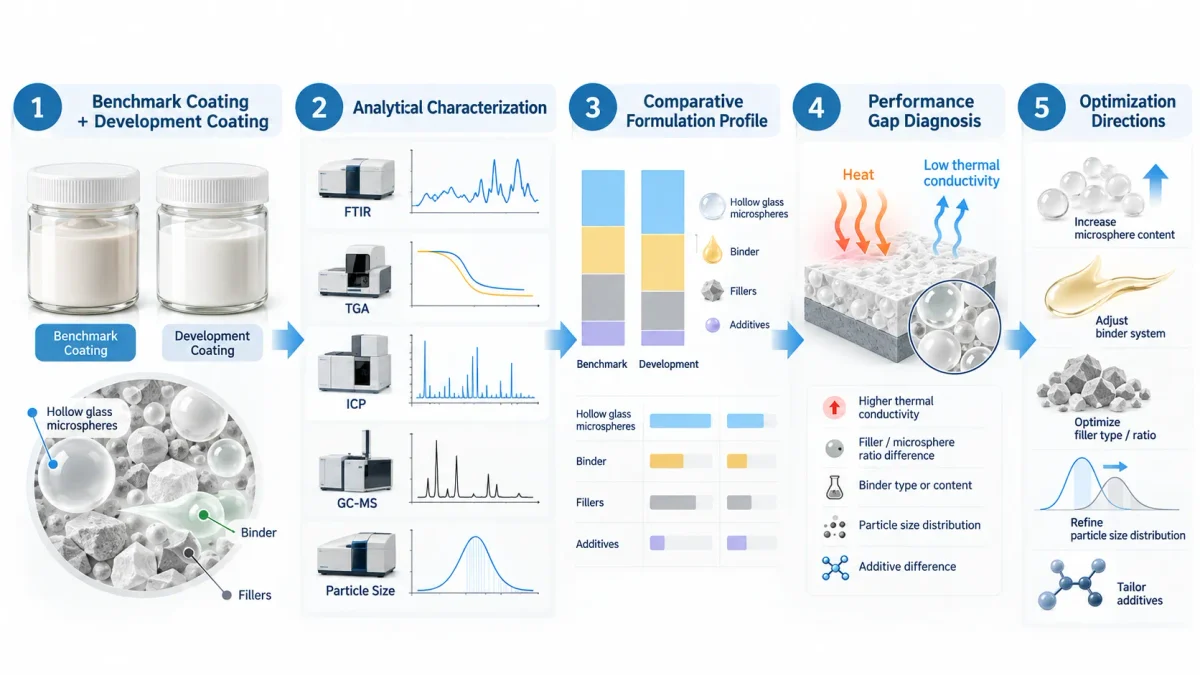
Thermal Insulation Coating Formulation: Key Differences
One of the clearest differences was the balance between low-density insulating filler and conventional mineral filler.
The benchmark contained a higher estimated level of hollow glass microspheres and a lower calcium-carbonate-rich filler fraction. The development sample showed the opposite pattern.
The benchmark also contained a platelet-type filler that was not detected at a comparable level in the development coating.
These results suggest that thermal performance depended on the overall filler architecture, rather than only on whether hollow glass microspheres were present.
The binder system also differed. The benchmark was interpreted as a pure acrylic system, whereas the development coating used a styrene-acrylic binder.
This does not mean that pure acrylic binders are universally superior. Binder performance depends on factors such as glass-transition temperature, solids content, film formation, pigment volume concentration, and filler compatibility.
The analytical conclusion is simply that binder chemistry was another significant formulation variable that required controlled validation.
Hollow Glass Microspheres and Thermal Conductivity
Hollow glass microspheres are commonly used in lightweight thermal-insulation coatings because their hollow structure can reduce effective thermal conductivity.
However, increasing their concentration does not guarantee a proportional improvement.
Research published in Progress in Organic Coatings showed that the thermal and mechanical performance of hollow-glass-microsphere composite coatings depended on filler concentration and interactions with the surrounding matrix. Optimized filler levels performed differently from simply increasing filler loading. Read the peer-reviewed study on hollow glass microsphere composite coatings
Particle size is another important variable.
The benchmark in this case showed a broader particle-size distribution, while the development sample was dominated by a narrower microsphere population.
That difference may affect packing, resin demand, particle number density, and coating microstructure. It should therefore be treated as a plausible performance factor rather than a proven single root cause.
A recent study on water-based acrylic insulation coatings similarly optimized the film-forming matrix, hollow glass microsphere particle size, microsphere content, and rheological system together rather than treating HGM concentration as an isolated variable. Read the study on hollow glass microspheres in acrylic thermal-insulation coatings
Water-Based Coating Formulation and Storage Stability
The development coating also showed settling and phase separation during storage.
Its formulation differed from the benchmark in several areas associated with suspension stability:
- lower estimated dispersant level;
- lower estimated defoamer level;
- no comparable cellulosic thickener identified;
- higher dense mineral filler content;
- different microsphere size distribution; and
- different binder chemistry.
These differences do not prove that one additive caused the storage problem.
Instead, they indicate that dispersion, rheology, filler density, and binder compatibility should be evaluated as a system.
The silane-type component detected in the benchmark is another variable worth investigating. Surface treatment can modify the interaction between glass microspheres and an organic binder, but better interfacial adhesion does not automatically mean lower thermal conductivity.
For example, a 2025 study on modified hollow glass microspheres in waterborne polyurethane coatings found improved interface-related properties while thermal conductivity changed in the opposite direction. This illustrates why interface optimization must be validated against several performance targets rather than assumed to improve every property simultaneously. Read the study on modified hollow glass microspheres in waterborne polyurethane coatings
Coating Failure Analysis and Formulation Optimization
Before the comparative analysis, the development strategy focused mainly on changing hollow glass microsphere content.
The formulation data suggested a broader validation plan.
The next round of experiments could compare:
- hollow glass microsphere loading;
- single-size versus mixed-size microspheres;
- reduced calcium carbonate loading;
- different binder systems under matched conditions;
- optimized dispersant and rheology packages; and
- untreated versus appropriately surface-modified microspheres.
Each variable should be evaluated under controlled conditions using the same coating thickness, conditioning procedure, and thermal-conductivity method.
This distinction is important in coating and material failure analysis: analytical differences can generate strong technical hypotheses, but a causal mechanism should be confirmed through targeted experiments.
The case therefore did not prove that one ingredient was responsible for the higher thermal conductivity.
Instead, coating formulation analysis narrowed a complex performance problem into a smaller set of testable formulation variables.
Conclusion
This thermal insulation coating case shows why reverse engineering should go beyond producing an ingredient list.
The benchmark and development coatings differed in hollow glass microsphere loading and particle-size distribution, mineral filler balance, binder chemistry, rheology, dispersion, and interface-related additives.
These differences provided several technically reasonable explanations for the observed thermal-performance and storage-stability gap, while also defining what needed to be validated next.
For coating manufacturers, the practical value of formulation analysis is therefore not “copying a recipe.” It is reducing blind trial-and-error and turning product benchmarking into an evidence-based formulation-development process.