Plastic Material Comparison Analysis: Why Similar FTIR Results Can Still Hide Critical Differences
xinbodi
Table of Contents
Many manufacturers assume that if two plastic materials have nearly identical FTIR or DSC results, they must be the same.
In practice, this is often not true.
Differences in additive systems, filler content, molecular weight distribution, crystallinity or trace components can significantly affect product performance, even when conventional tests appear similar.
This article explains how comprehensive plastic material comparison analysis can identify these hidden differences through a real industrial case.
The Challenge: A PBT Material Suddenly Failed
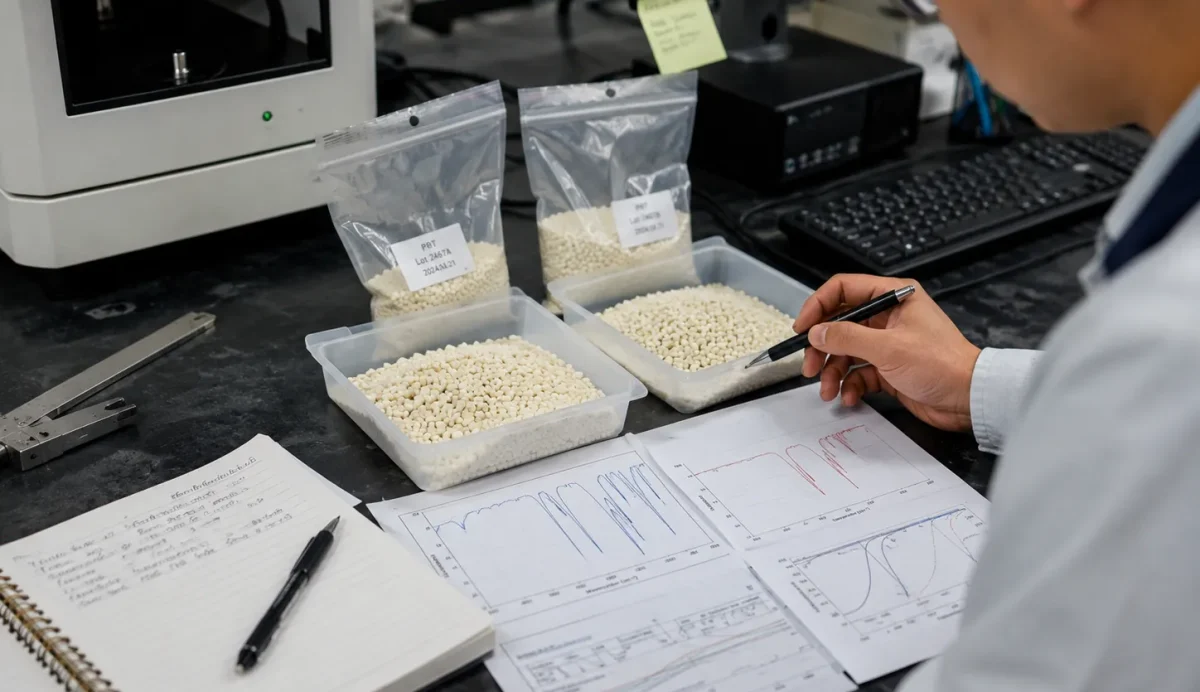
A manufacturer using flame-retardant PBT resin noticed an unexpected problem.
The material had performed reliably for years, but during summer production it began to deform when tested at 85°C.
Initial investigations found no obvious differences.
FTIR spectra appeared almost identical.
DSC showed similar thermal transition behavior.
The supplier insisted that the formulation had not changed.
However, the customer suspected that the raw material might have been substituted or modified without notice.
The goal was straightforward:
Determine whether the two PBT materials were truly identical or whether subtle formulation differences were responsible for the performance change.
Why Standard Testing Was Not Enough
Traditional identification methods are excellent for confirming polymer types.
For example:
FTIR confirms the resin family.
DSC measures glass transition and melting behavior.
However, they may not detect:
Minor additive changes
Different flame-retardant packages
Filler grade variations
Small molecular weight shifts
Low-level processing additives
A peer-reviewed study of PBT nanocomposites found that changes in nano-additive chemistry, dispersion and interfacial interaction altered crystallization behavior, thermal stability and mechanical properties, even though the DSC melting temperatures of the PBT samples remained nearly unchanged.
These factors can influence thermal stability and long-term performance while leaving routine test results almost unchanged.
A Multi-Technique Comparison Strategy
Instead of relying on one analytical method, Xinbodi designed a comparison workflow covering both composition and performance.
Composition Comparison
The first step focused on identifying differences in chemical composition.
Techniques included:
FTIR — polymer and functional group identification
SEM–EDS — filler morphology and elemental composition
XRF — inorganic filler and flame-retardant screening
Together, these techniques reveal whether processing history, resin grade or polymer degradation contributes to the observed performance difference.
What the Comparison Revealed
Rather than simply confirming that both samples were “PBT,” the comparison generated a much more detailed picture.
The final report included:
Composition and relative content of major components
Comparison of additive systems
Instrumental spectra and analytical interpretation
Side-by-side comparison of both materials
Identification of formulation differences related to flame retardants, fillers and polymer characteristics
This level of information helps manufacturers determine whether supplier changes, formulation adjustments or processing variations are responsible for unexpected product behavior.
When Is Plastic Material Comparison Useful?
Material comparison analysis is valuable whenever two samples appear similar but perform differently.
Typical applications include:
Supplier qualification
Incoming material verification
Domestic replacement evaluation
Product quality investigation
Batch-to-batch consistency assessment
Failure investigation
Competitor material comparison
Instead of asking only “Are these the same material?”, manufacturers can answer a much more important question:
What exactly is different, and how will it affect product performance?
Need Plastic Material Comparison Analysis?
Xinbodi Laboratories provides plastic composition analysis, formulation comparison, reverse engineering and material difference analysis for engineering plastics, polymer compounds and specialty materials.
By combining multiple analytical techniques, we help manufacturers identify formulation differences, verify raw materials and support supplier evaluation, quality control and product optimization.